Contents
Abstract 3
Introduction 4
Qualitative Risk Analysis 5
Quantitative Risk Analysis 11
Aggregate Risk Responses 12
Probability Distributions 13
Monitoring Risks 14
Earned Value Management (EVM) 15
Simulations & Modeling 15
Overall Risk Analysis 16
Conclusion 17
References: 17
Abstract
Information and communicating are keys to managing projects to a successful conclusion. Knowing the work and the risks are the best defense for handling problems and delays. Assessing potential overall project risks brings to the forefront the need for changing project objectives. It is these risk analysis tools that allow the Project Manager to transform an impossible project into a successful project (Campbell, 2012). Project risks become increasingly difficult when dealing with an unrealistic timeline or target date when given insufficient resources, or insufficient funding. Knowing the risks can help to set realistic expectation levels of deliverables and the work required given the resources and funding provided. Managing risks means communicating and being ready to take preventive action. The PM cannot be risk-averse; accepting risk will happen is part of the job, doing nothing is not an option (Gido & Clements, 2012). The PM needs to set the tone of their projects by encouraging open and frank discussions on potential risks. The PM needs to encourage identifying risks, the potential impact of the project, and the likelihood of occurrence, develop risk response plans, and monitor those risks. This paper will explore using qualitative and quantitative risk analysis in determining overall project risk.
Introduction
Project Managers (PM) use qualitative risk analysis to determine the probability of a risk occurring and the impact it could have on the project (PMBOK, 2013). A risk is an uncertain event whose occurrence could put the project in jeopardy if not addressed properly. The PM can use qualitative risk analysis to assess the probability the potential risk has to occur using a variety of inputs including the risk management plan, the scope baseline, the work breakdown structure (WBS), enterprise environmental factors, and organizational process assets. The PM will use expert judgment to develop probability and impact assessment; which he will input the results from these estimates into a probability/impact matrix. The PM will use the results from the probability/impact matrix and the expert judgment to determine a ranking of the potential risks to determine which of these risks require further in-depth analysis to develop detailed mitigation plans.
Planning for risks is a must in any project. A framework needs to be followed that includes identifying risks, analyzing and prioritizing, developing responses, establishing contingencies, and monitoring and controlling these risks\ (Verzuh, 2012)
Managing risks have to be considered an enterprise capacity. This consideration means the project risk register has to associate each risk with a strategic goal of the company (Kerzner, 2015). If the risk solution is not connected to a strategic goal of the company, then there is the added risk of failing to meet the strategic objectives of the company.
These detailed response plans and the work that goes into developing them, are quantitative risk analysis. The benefit of quantitative risk analysis is that it helps the PM and upper management to determine what resources and time commitment to handling a risk should it occur, and at what cost. Knowing the impact costs of the high probability risks helps organizational management to decide if the risks of taking on a project far outweigh the benefits. One of the tools used in making a go-no-go determination is a cost-benefits analysis to be discussed later in this paper.
Sources of project risks include unrealistic schedules, few resources, thin budgets, no or ill-defined metrics meaning ineffective or guesswork measurements, poor project leadership, poorly defined requirements or planning, ineffective change control plans leading to scope creep. Other examples of risk include upgrading old technology to new technologies; availability of resources; excessive revisions to a website before it’s finally acceptable to the customer; price increases of a planned product before it’s time to buy the product. The risks that could occur run the gambit of possibilities depending on the nature of the project.
This paper will discuss how qualitative and quantitative risk analysis is used to provide the information needed to make decisions concerning projects. The information derived from using qualitative and quantitative risk analysis helps to provide direction to a project, often changing the scope of the project due to findings in the analysis. The answers provided here will determine if moving forward with the project is worth the risk.
Qualitative Risk Analysis
Perform qualitative risk analysis prioritizes risks by ranking them in order of probability and impact. Ranking risks by their likely probabilities allow the PM to identify what the project team feels are the risks that will need in-depth analysis to determine potential impact costs on the project. Roles and responsibilities for determining risks, budgets, and schedule impacts can be defined in qualitative risk analysis. Risk categories are determined; probabilities and areas of impact are defined. The risk register and probability/impact matrix contain all the information developed during the analysis.
The ranking is determined by assessing the probability the risk will occur. The benefit of this analysis is it allows the PM to concentrate on high priority risks reducing the level of uncertainty (PMBOK, 2013). Probabilities are determined by using expert judgment, interviews, or meetings with individuals chosen for their expertise in the area of concern to the project. These experts can be either internal or external to the project. The probability level of each risk is determined in each meeting; details are examined and justified as are levels of probability.
Impact analysis investigates the effect risk will have on the project’s schedule; cost, quality, ability to meet project scope. The impact analyses will also look at the positive or negatives effects of a risk on the project. If the level of impact is great enough and its probability of occurring high enough, it will merit quantitative analyses to determine the exact effect, it will have on the project.
Inputs to the qualitative risk analysis process include the project risk management plan. Here, the roles and responsibilities of managing risk are defined. Budgets, schedules, resources are defined as well. The scope baseline is considered an input; includes the approved scope statement, the WBS, and the WBS Dictionary. These inputs can only change through approved change control procedures (Mullaly, 2011).
The risk register serves as both input and as output to the qualitative risk process. It is used to identify and track all risks connected with a project. It covers all of the outcomes of the various risk processes used to identify the risks. Each identified risk is assigned a unique number, is given a risk name, and assigned a risk owner, an explanation of the risk, the probability of the risk occurring, as well as including the rank of the risk. The risk register includes a trigger and a list of potential responses. The impact of the project should the risk become an issue, a plan of action (mitigation), and the current status of the risk is also included (Schwalbe, 2014).
The identification number is used to give a unique identification code to the risk to differentiate from all the other risks. There is the chance that some risks, even though dissimilar, will seem to be similar. The team applies a unique numbering system to identify the risk, therefore, avoiding confusion.
Each risk should have an easily understood name that accurately describes the risk in a few words. The purpose of this name is to make it easy to identify a given risk when simply glancing at the whole list (Robertson & Robertson, 2013).
Every risk should have a risk owner; every owner can own more than one risk. The risk owner responsibility is for tracking the status of the risk. The risk owner is responsible for assisting in developing a risk plan for each of their risks. They are responsible for notifying the team and management that the risk has become an issue and for launching the approved risk plan for the occurring risk.
A description of the risk should be concise, to the point. It should contain the risk description, the trigger event, the probability of the risk occurring. The explanation should describe why this is considered a risk and the impact on the project should it occur. This explanation should contain the plan to mitigate the risk should it become an issue (Kendrick, 2012).
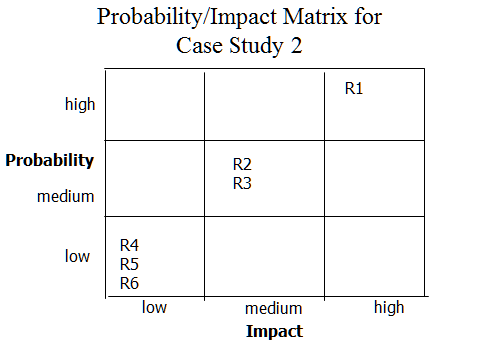
The probability of risk occurrence is very important in developing possible responses and deciding to commit resources to mitigate the risk should it occur. A PM can chart these probabilities, and the impact of the project, using a probability/impact matrix. The matrix is divided into categories; high risk; low risk; medium risk. The matrix makes it easier to identify which risks are high risks and need special attention because of their likelihood of occurring (PMBOK, 2013). See Figure 1 below for an example of a probability/impact matrix.
Once the PM has completed identifying risks, determining their probability of occurring, plotted this data in a matrix, he can determine a rank for each risk. This rank allows the PM to identify quickly the most important risks that will have the highest impact on the project and will require extra resources should it occur. We used the probability of occurrence and the impact level to determine rank. Those risks with high probability and greatest impact were ranked highest. Risk probability assessments explore the possibility of a risk occurring, while risk impact analysis investigates the potential effect the risk can have, such as budgeting, on the project. The probability of a risk occurring is determined, and each risk gets a risk rating. Each risk can then be plotted using a probability/impact matrix and categorized as high, medium, or low level of impact on the project (Schwalbe, 2014). The trigger tells the team to watch for a specific event to occur to tell them a risk is happening
Potential response(s) are a list of the plans, and their location in the system that tells the team how to deal with a risk when it occurs. A risk response plan is a defined action designed to prevent or minimize the impact or occurrence of an adverse event (Gido & Clements, 2012). Risk response plans can be designed to avoid a potential risk, mitigate the risk, or accept it. Avoidance means eliminating the risk by either choosing a different course of action or designing a resolution to it. Mitigation can also design a solution, but also includes ways to minimize the risk impact. Accepting means dealing with the risk should it occur, otherwise do nothing. Many low probabilities or low impact risks are accepted due to the small likelihood of occurrence. These responses would be of sufficient detail to allow for easy determination of the impact costs. Response describes the impact of the project in the event a risk becomes an issue. The impact, should a risk occur, defines what the cost would be to the project. In the case of a negative risk, it costs the project dollars in time and resources. If the risk is positive, the cost is in the loss of a potential gain. Status tells the team if the risk has potential or is considered unlikely to occur.
See Table 1 below for an example of a risk register.
Table 1 – Example Risk Registry
| No | Rank | Risk | Description | Category | Root Cause | Triggers | Potential Responses | Risk Owner | Probability | Impact | Risk Score | Status |
| R1 | 1 | Project loss | Member could be reassigned or leave company | Project risk | Management decision | Team member no longer here | Bring in replacement | PM | 10 | 10 | 100 | Mitigation plan in-place in case risk occurs |
| R2 | 2 | Increase in health costs | Health costs could increase | Budget risk | Non-use of system; users discovering unrealized health issues causing temporary increase in health costs | budget reports showing increased costs | Increase training on system usage; increase enforcement by management on required usage of system | HR | 5 | 5 | 25 | Plan in place to increase awareness of trigger action; management to be informed |
| R3 | 3 | Hard to use system | The system could prove harder to use for a variety of reasons | System use | Poor design; non-intuitive navigation; poor usage training | low usage; a high number of complaints | Further training; increase incentives; surveys to determine usage issues | PM/HR | 5 | 5 | 25 | Plan to track usage and increase trigger actions in place |
| R4 | 5 | Low number of users | Potentially no one will use the system for a variety of reasons. | Systems usage | Non-interest; ineffective enforcement of required usage by employees | Low usage numbers; lack of feedback on system | Increased enforcement of usage requirements; conduct survey to determine issues with non-usage | HR | 2 | 2 | 4 | Tracking users activity, reporting usage numbers monthly |
The outputs of qualitative risk process are the risk register and the assumption log. Each document is updated throughout the project.
Quantitative Risk Analysis
Knowledge of how risk can potentially impact a project is the best way to avoid costly delays in a project. It is incumbent on managing projects to a successful conclusion. Overall project risk assessment provides the needed information to make changes in project strategy and meeting project objectives. Thoroughly understanding and assessing risks can change an impossible project into a successful project. Expectations can be altered for projects with few resources and unrealistic schedules, and assessing risks expose evidence of these cases.
Risks have one of two possible values; either it occurred or didn’t occur. Qualitative risk analysis will put risks into a range of possible values; usually high-medium-low. Qualitative methods do not use numeric values. Qualitative risk analysis aid in the quick determination of a risk occurring and its potential impact.
Quantitative analysis requires deeper analysis into the risk; it requires more work gathering data to determine the magnitude of impact the risk will have on the project. Quantitative analysis works towards greater precision revealing more about the risk than qualitative analysis. It is the process of mathematically analyzing the effect of risks on overall project goals. The quantitative analysis puts risk into a tighter specific range of fractions of zero, where the range is from zero to one, or between zero and one hundred percent (Kendrick, 2012). Quantitative analysis of that high probability, high impact risks may be estimated down to hours, days of slippage, money units clarify the precise impact of the project. Sensitivity Analysis, rigorous statistical analysis, decision trees, and simulations provide deeper information into the potential risks and could aid overall project risk analysis. The key benefit of quantitative analysis is the information produced that allows for effective decision making and the removal of uncertainty. Communications are key (High Cost of Low Performance: The Essential Role of Communications, 2013).
The key inputs are the risk management plan, the cost management plan, the schedule management plan, enterprise environmental factors, and organizational process assets; information from past projects; such as planning documents (PMBOK, 2013).
Considering each risk by itself, one would think it would be easily manageable. You would be correct, so long as this single risk is the only risk. But put all of the identified risks together and they could prove insurmountable enough to cancel the project. Overall project risk comes from aggregating the data to show a complete picture of the total impact on the project.
As planning for the project nears completion the team should have multitudes of information available. Assessing project risk should be easier at this point in the project. There are some tools the PM can use further to analyze project risk including statistical analysis, metrics, and modeling and simulation tools. These tools can be used to suggest changes, control outcomes, and execute the project to a successful conclusion.
Methods for assessing overall project risk have been shown to be effective in lowering the impact of the project as well as providing information for making appropriate decisions on moving forward with a project. These assessments can build support for less risky projects while canceling more risky projects. These methods can help to compare projects to see which help to meet the organization’s objectives better than other projects. Information is provided to allow for altering unrealistic project objectives and provide for needed funding reserves. They also improve communications as the information is formulated (Kerzner, 2014).
Aggregate Risk Responses
There are some ways in which to determine the level of overall risk in a project. There are some measurements where aggregation serves as a means to determine overall risk assessment. One method is to add up all of the consequences of the entire project risks. This method is “loss time’s likelihood”, based on the estimated cost, or time involved multiplied by the risk probability, aggregated for the whole project (Kendrick, 2012). One way to add these consequences is to add up the contingency plans of all the risks.
Using the Program Evaluation and Review Technique (PERT) expected estimates could generate similar data as aggregating the consequences. PERT provides estimates as to the most likely, optimistic, and pessimistic amount of time it would take to complete a task. Adding these estimates up gives the PM a range of how long it would take to complete a project. Each risk can use PERT to provide a three-point estimate that is aggregated with all other risk estimates to determine the overall impact on the project.
The PM has to keep in mind that these are guestimates only providing a baseline in which to work. Consequence measurements assume that all risks are independent with no correlation to other risks. This independence is not entirely true as in some cases risk becomes more likely when other risks have occurred (Marchewka, 2015). Once a risk has occurred, the team is concentrating on problem-solving to the neglect of the rest of the project, making it likely more risks will occur as a result.
Probability Distributions
Quantitative analysis includes mathematical and statistical modeling allowing the PM to simulate different outcomes.
Discrete probability distributions allow only for integer or whole number outcomes. It’s an either/or outcome. It is much like flipping a coin where eventually you end with 50% heads and 50% tails as an outcome. In risk analysis this would analogous to determining if it will rain on the day of an outdoor wedding; either it will or it won’t.
Continuous probability distributions are useful where an event could have numerous possible outcomes depending on the value given. Continuous probability distributions are good for developing models of risk analysis.
Three such continuous probability distribution models are:
- The normal distribution; commonly referred to as a standard bell curve where the mean and standard deviation determine the shape of the distribution; the probability defines an area under the curve.
- PERT is a three-point measurement for defining the area under the curve using optimistic, most likely, and pessimistic estimations.
- Triangular distribution uses similar measurements as PERT; the difference is the weight given to the mean and standard deviation.
Monitoring Risks
Risk monitoring means assigning a risk to one individual, usually a member of the team where the risk will have the greater impact, to plan and monitor for the trigger events of the risk. It is very important to review all risks regularly to determine if the probability of occurring or the impact of the project has changed. Many times these changes can be identified due to progressive elaboration; we’ve learned more as we have progressed with the project. The team may also be able to identify other risks not considered when the risk management plans were initially developed. Scope, schedule, or budget changes may have occurred as the project progressed.
Risk audits involve using an outside manager to review the team to ensure the proper processes are in place and used. The auditor has to ensure that monitoring processes are in place for identifying trigger events when they occur, to ensure that a communication plan is defined and ready for action should a risk event occur.
Risk review meetings should be held at regular intervals; usually monthly, and should include stakeholders, managers, and the project team. All participants in a project need to be keenly aware of the risks and the current status of each.
Earned Value Management (EVM)
Earned Value Management (EVM) will help to provide an early indication to the PM and upper management, of potential project risks (Fleming, 2010). It can indicate that the project will need more money to complete unless actions are taken to change upcoming events. The project scope may need changing, perhaps reduced. Perhaps additional risk needs to be taken or considered. EVM is a tool the PM uses to track project performance allowing for early warnings that the project is off track
Simulations & Modeling
Simulations and modeling are quantitative analysis tools that allow the PM to examine different possible outcome scenarios and determine the probabilities of each event are occurring. Monte Carlo simulation is one such technique which randomly produces values for a variable with a specific probability distribution. The Monte Carlo simulation goes through some iterations and records the outcomes. The Monte Carlo simulations are used for either continuous or discrete probability distributions (Marchewka, 2015)
Overall Risk Analysis
“Program” is a term that means a group of related projects managed in a way so that resources and funds are effectively utilized. The main objective for program management is better overall control of interconnected projects than there would if each project were left to their own devices. Projects can be run in sequence or parallel to each other. While projects have specific target dates to hit, programs can be open-ended too. Programs may contain only a few projects to as many as hundred’s of projects.
Risk management for a program can be as simple as aggregating the risk and response plans for small programs to sophisticated strategies to deliver benefits and value. The main purpose of program management is to deal effectively with the thousands of different activities and tasks that are difficult to manage within a single project. Program management can provide organizational strategies in planning a risk response for each project, allowing for the project to create a response that meets organization objectives (Harpham, 2015).
Overall risk analysis in a project consists of aggregating all the risk probabilities and impacts to determine the level of risk to the overall project itself (Wurzler, 2013). If the cost of the risk is greater than the benefits derived from completing the project, than the project is either reexamined and changed or canceled altogether. In programs, the risk could morph into a sum greater than its individual components. That is, while each project’s risk is not so great, add them up could produce a result too great for the organization to take on.
Conclusion
The PM needs to take note that no matter which methods he uses, he has to ensure that all risks are accounted and planned for (Verzuh, 2012). Many times the PM cannot get the information needed to do a proper quantitative analysis. Many times members of the organizational community think it’s a waste of time to conduct a risk analysis. Many contracts I’ve held I have heard people explain that they already know about a risk and will deal it with it if it occurs when it occurs. I have used qualitative extensively because of being left with no other choice having exasperated all other options. As pointed out in this paper, the PM has to do the qualitative analysis first before any quantitative analysis can begin. Doing qualitative first leads to deeper quantitative analysis. The PM has to identify the risk first before determining its impact.
References:
Campbell, P. M. (2012). Communications skills for project managers. New York, NY: Amacom American Managemen.
Fleming, Q. W., & Koppelman, J. M. (2010). Earned value project management. Newtown Square, PA: Project Management Institute.
Gido, J., & Clements, J. P. (2012). Successful project management. Australia [etc.: South-
Western Cengage Learning.
Harpham, B. (2015, March 30). ProjectManagement.com – Leveraging the Best Knowledge
Management Practices. Retrieved from http://www.projectmanagement.com/articles/293355/Leveraging-the-Best-Knowledge-Management-Practices
The High Cost of Low Performance: The Essential Role of Communications [Web log post].
(2013, May). Retrieved from http://www.pmi.org/~/media/PDF/Business-Solutions/The-
High-Cost-Low-Performance-The-Essential-Role-of-Communications.ashx
Kendrick, T. (2012). Results without authority: Controlling a project when the team doesn’t
report to you (2nd ed.). New York, NY: AMACOM.
Kerzner, H. (2015). Project management 2.0: Leveraging tools, distributed collaboration, and
metrics for project success. Hoboken, NJ: John Wiley & Sons.
Kerzner, H. (2014). Project recovery: Case studies and techniques for overcoming project
failure. Hoboken, NJ: John Wiley & Sons, Inc
Marchewka, J. T. (2015). Information technology project management, 5th edition. Hoboken,
NJ: John Wiley & Sons, Inc.
Mullaly, M. (2011, March 1). ProjectManagement.com – A Critical Look at Project Initiation.
Retrieved from http://www.projectmanagement.com/articles/262617/A-Critical-Look-at-
Project-Initiation
Project Management Institute. (2013). A guide to the project management body of knowledge
(PMBOK guide), fifth edition. Newtown Square, PA: Author.
Robertson, S., & Robertson, J. (2013). Mastering the requirements process: Getting
requirements right. Upper Saddle River, NJ: Addison-Wesley.
Schwalbe, K. (2014). Information technology project management. Boston, MA: Course
Technology.
Verzuh, E. (2012). The fast forward MBA in project management, fourth edition. Hoboken, NJ:
John Wiley & Sons.
Wurzler, J. (2013). Information risks and risk management. Retrieved from Sans Institute website: https://www.sans.org/reading-room/whitepapers/dlp/information-risks-risk-management-34210